Discussion
Loading...

Post

  • About
  • Code of conduct
  • Privacy
  • Users
  • Instances
  • About Bonfire
Gender Census
@gendercensus@fediverse.gendercensus.com  ·  activity timestamp 4 weeks ago

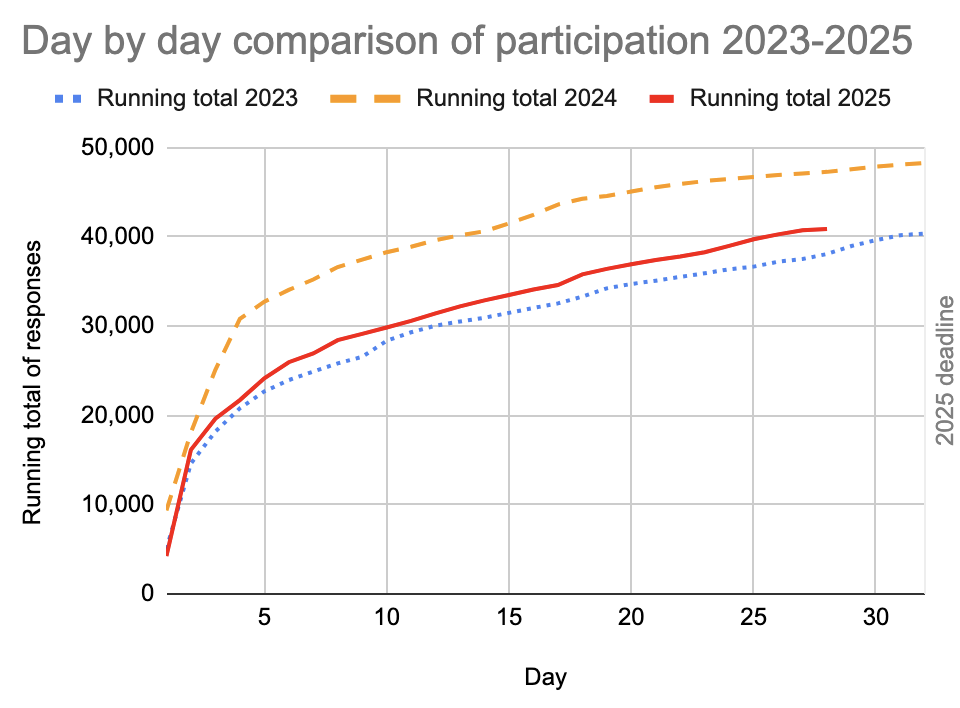
There are four days left, and we're fast approaching 41,000 participants!

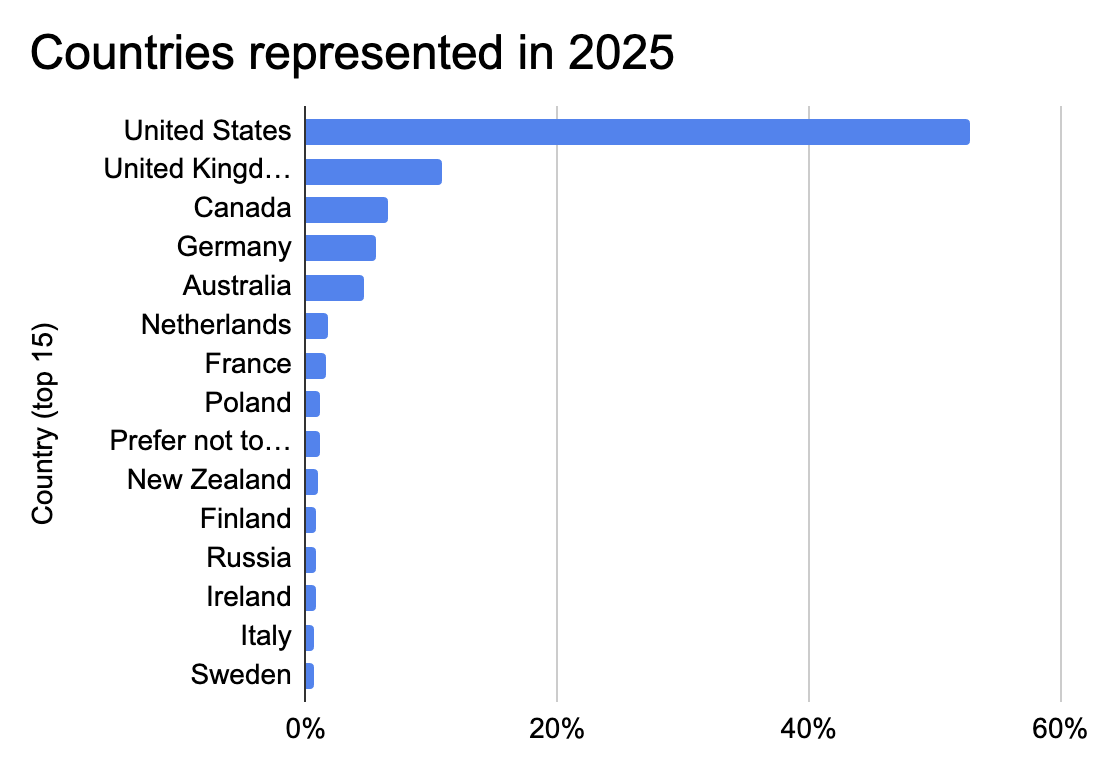
Any shares outside of the white-Tumblr-USA-under30s bubble is really helpful. This year the USA/UK/Canada proportion is lower than last year, so your efforts are working!

https://survey.gendercensus.com

#LGBT#LGBTQ#LGBTQIA #gender #survey #pride#GSM

Bar chart. Title: Countries represented in 2025.
Top 15:
United States, 52.8%
United Kingdom, 10.9%
Canada, 6.5%
Germany, 5.5%
Australia, 4.7%
Netherlands, 1.7%
France, 1.6%
Poland, 1.2%
Prefer not to say, 1.1%
New Zealand, 1.0%
Finland, 0.8%
Russia, 0.8%
Ireland, 0.7%
Italy, 0.7%
Sweden, 0.7%
Bar chart. Title: Countries represented in 2025. Top 15: United States, 52.8% United Kingdom, 10.9% Canada, 6.5% Germany, 5.5% Australia, 4.7% Netherlands, 1.7% France, 1.6% Poland, 1.2% Prefer not to say, 1.1% New Zealand, 1.0% Finland, 0.8% Russia, 0.8% Ireland, 0.7% Italy, 0.7% Sweden, 0.7%
Graph showing participation in 2023, 2024 and 2025. All lines rise sharply at the beginning and then the slope flattens a bit more after the first week and towards the end. The 2023 line ends at about 40,000. the 2024 line is much higher, ending at 48,000. 2025 is almost but not quite complete, and the line is a little higher than 2023 but a lot lower than 2024.
  • Copy link
  • Flag this post
  • Block
Log in

bonfire.cafe

A space for Bonfire maintainers and contributors to communicate

bonfire.cafe: About · Code of conduct · Privacy · Users · Instances
Bonfire social · 1.0.0-rc.2.21 no JS en
Automatic federation enabled
  • Explore
  • About
  • Members
  • Code of Conduct
Home
Login