

In #foss4ge2025 I was talking about Mercator projection, and what is the difference with "Web-Mercator"
These images (at different zoom levels) show a loxodromic curve (at 45° N) in Web-Mercator (EPSG:3857) - that is a straight line in Mercator (EPSG:3395). In red the loxodromic or rhumline. In blue a straight line connecting the endpoints.
(To reproduce it in #QGIS, deselect "Clip features to canvas extent" for the affected layers as discussed in https://github.com/qgis/QGIS/issues/62654)
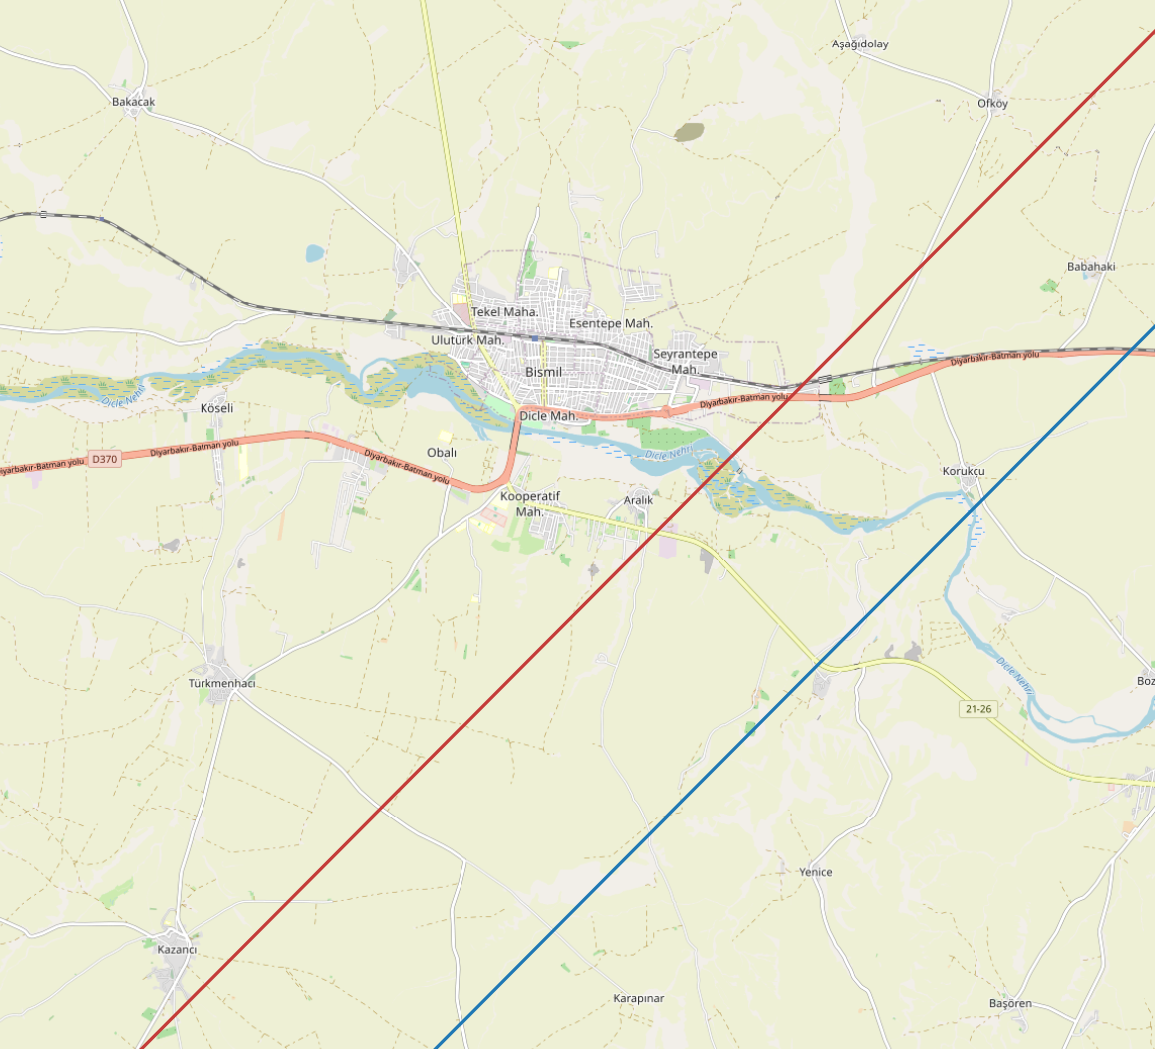
Loxodromic curve in Web-Mercator (red) vs straight line connecting the end endpoints (blue). Higher zoom level.
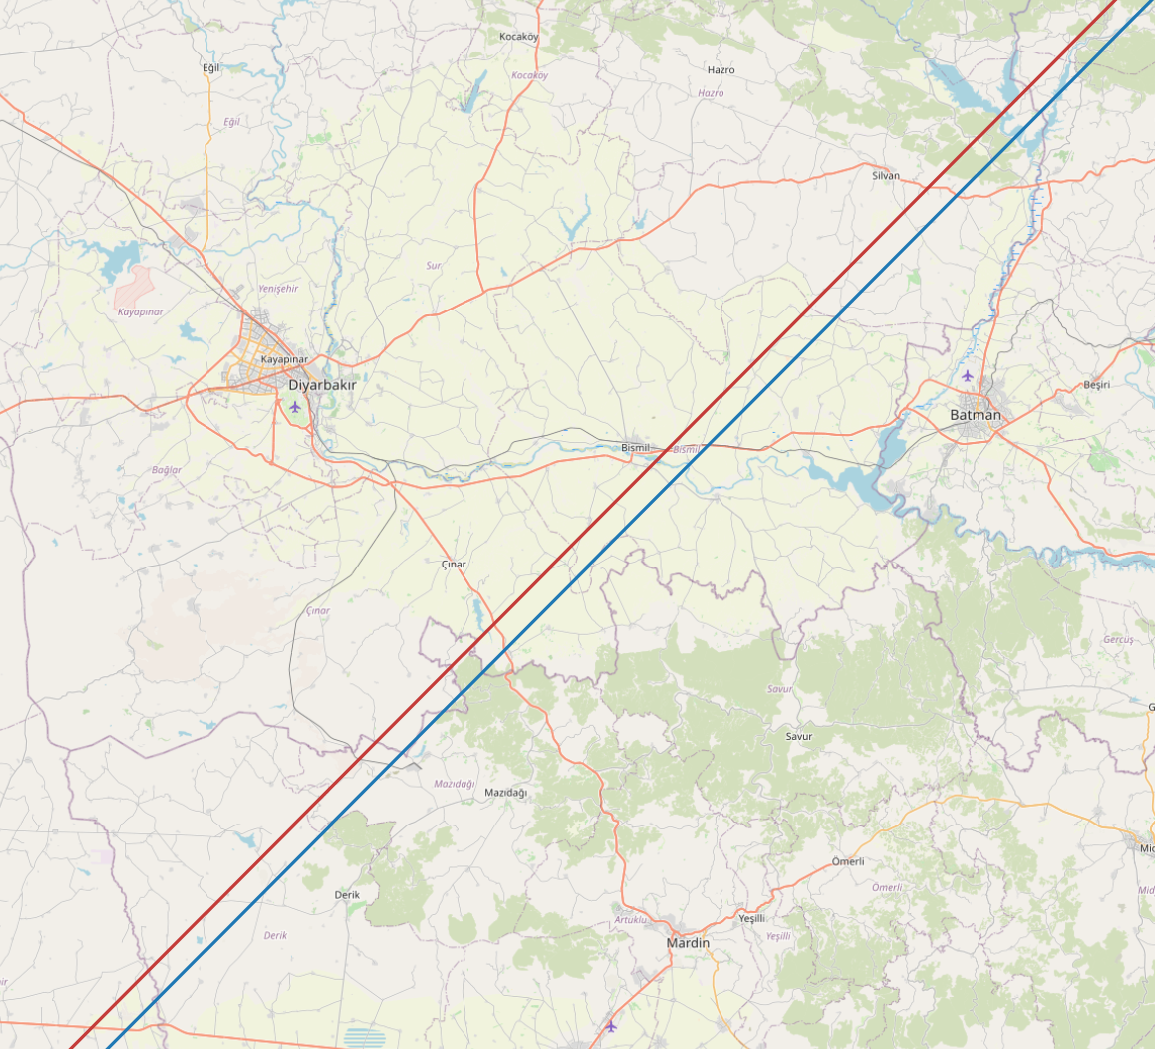
Loxodromic curve in Web-Mercator (red) vs straight line connecting the end endpoints (blue). High zoom level.
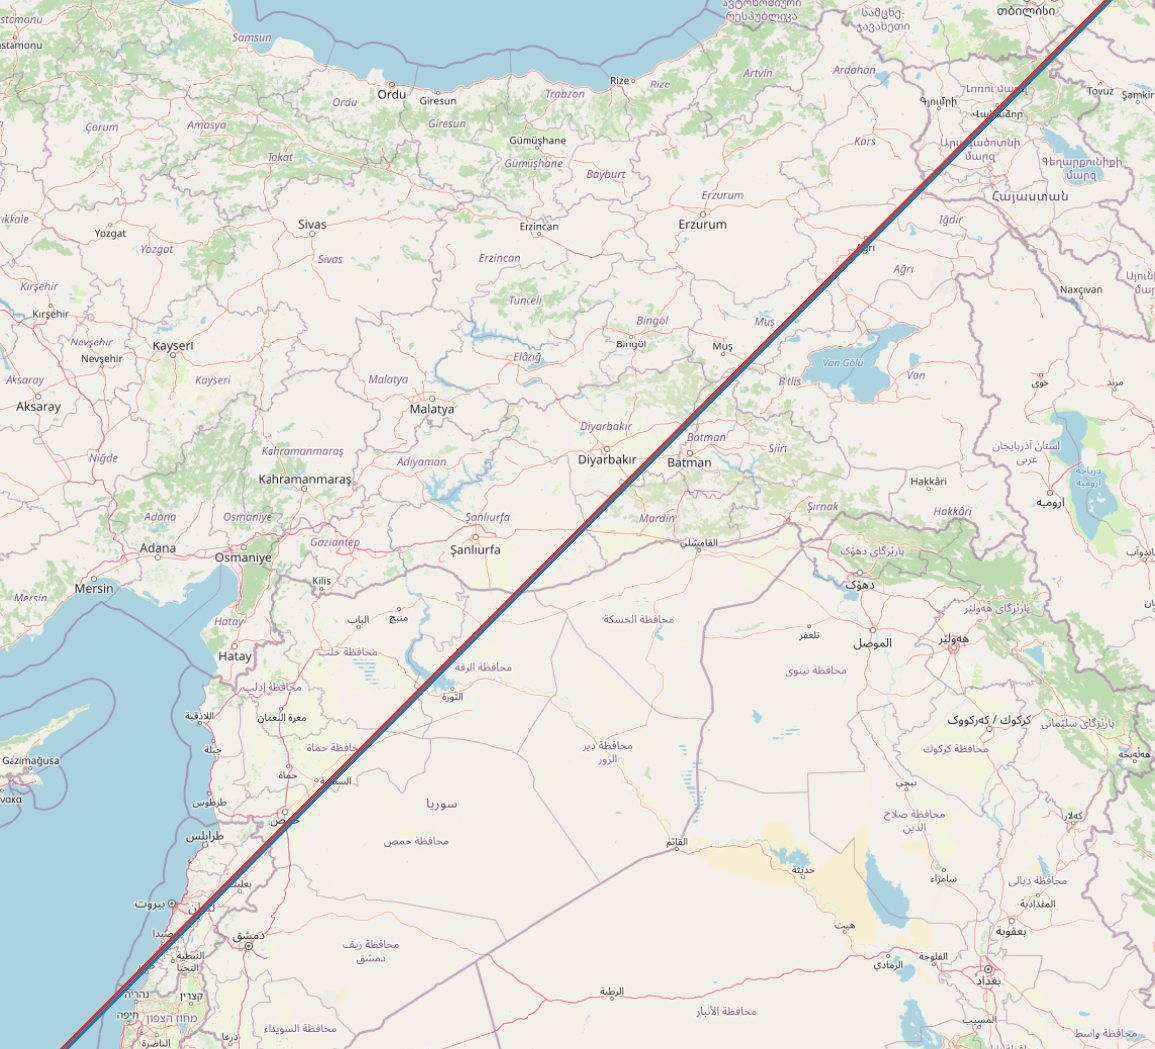
Loxodromic curve in Web-Mercator (red) vs straight line connecting the end endpoints (blue). Mid zoom level.
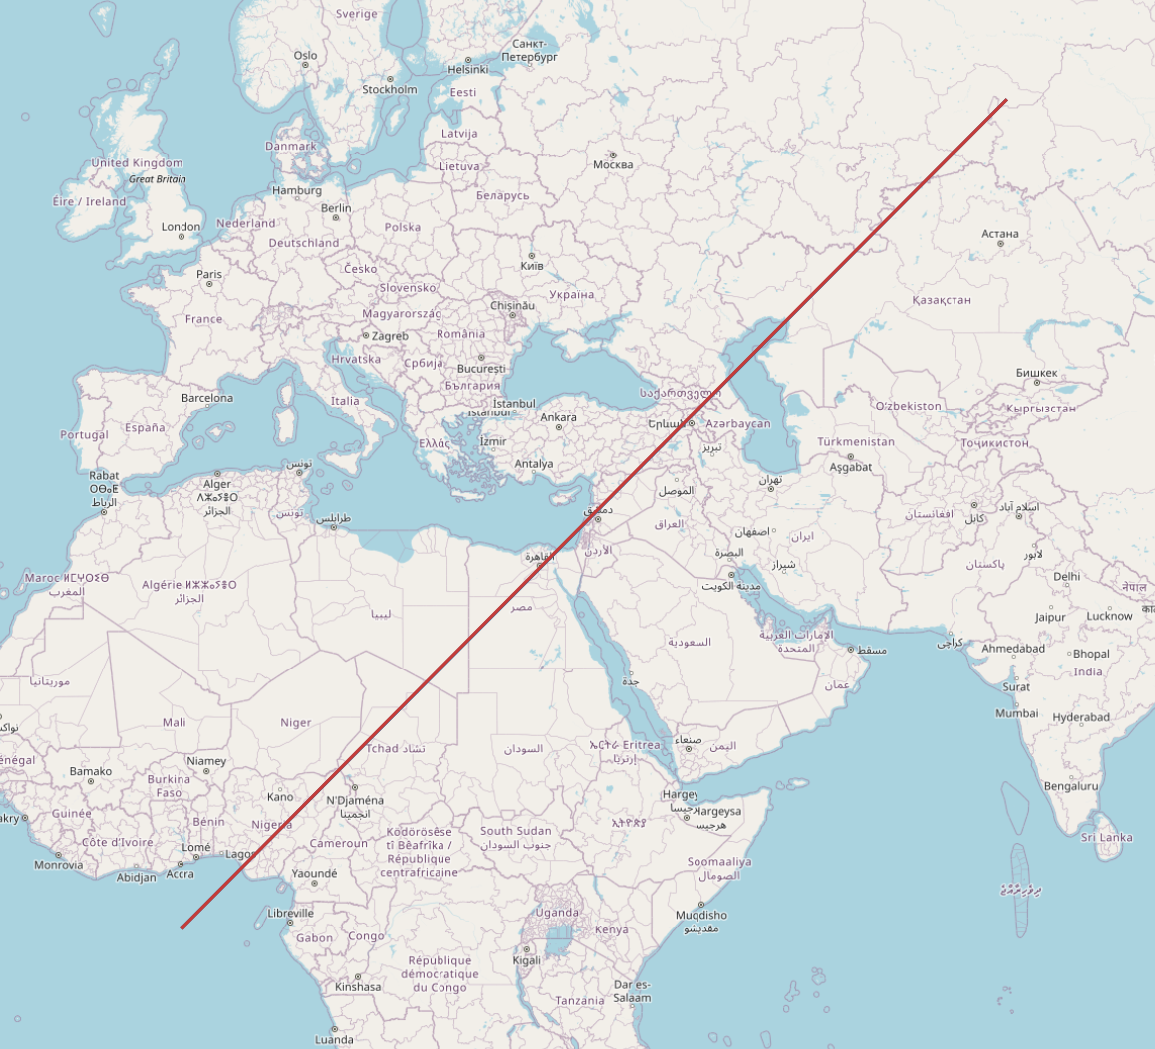
Loxodromic curve in Web-Mercator (red) vs straight line connecting the end endpoints (blue). Low zoom level.