A comprehensive analysis of market concentration and operating system market share, featuring two distinct sections, all in WezTerm.
**Market Concentration Analysis**
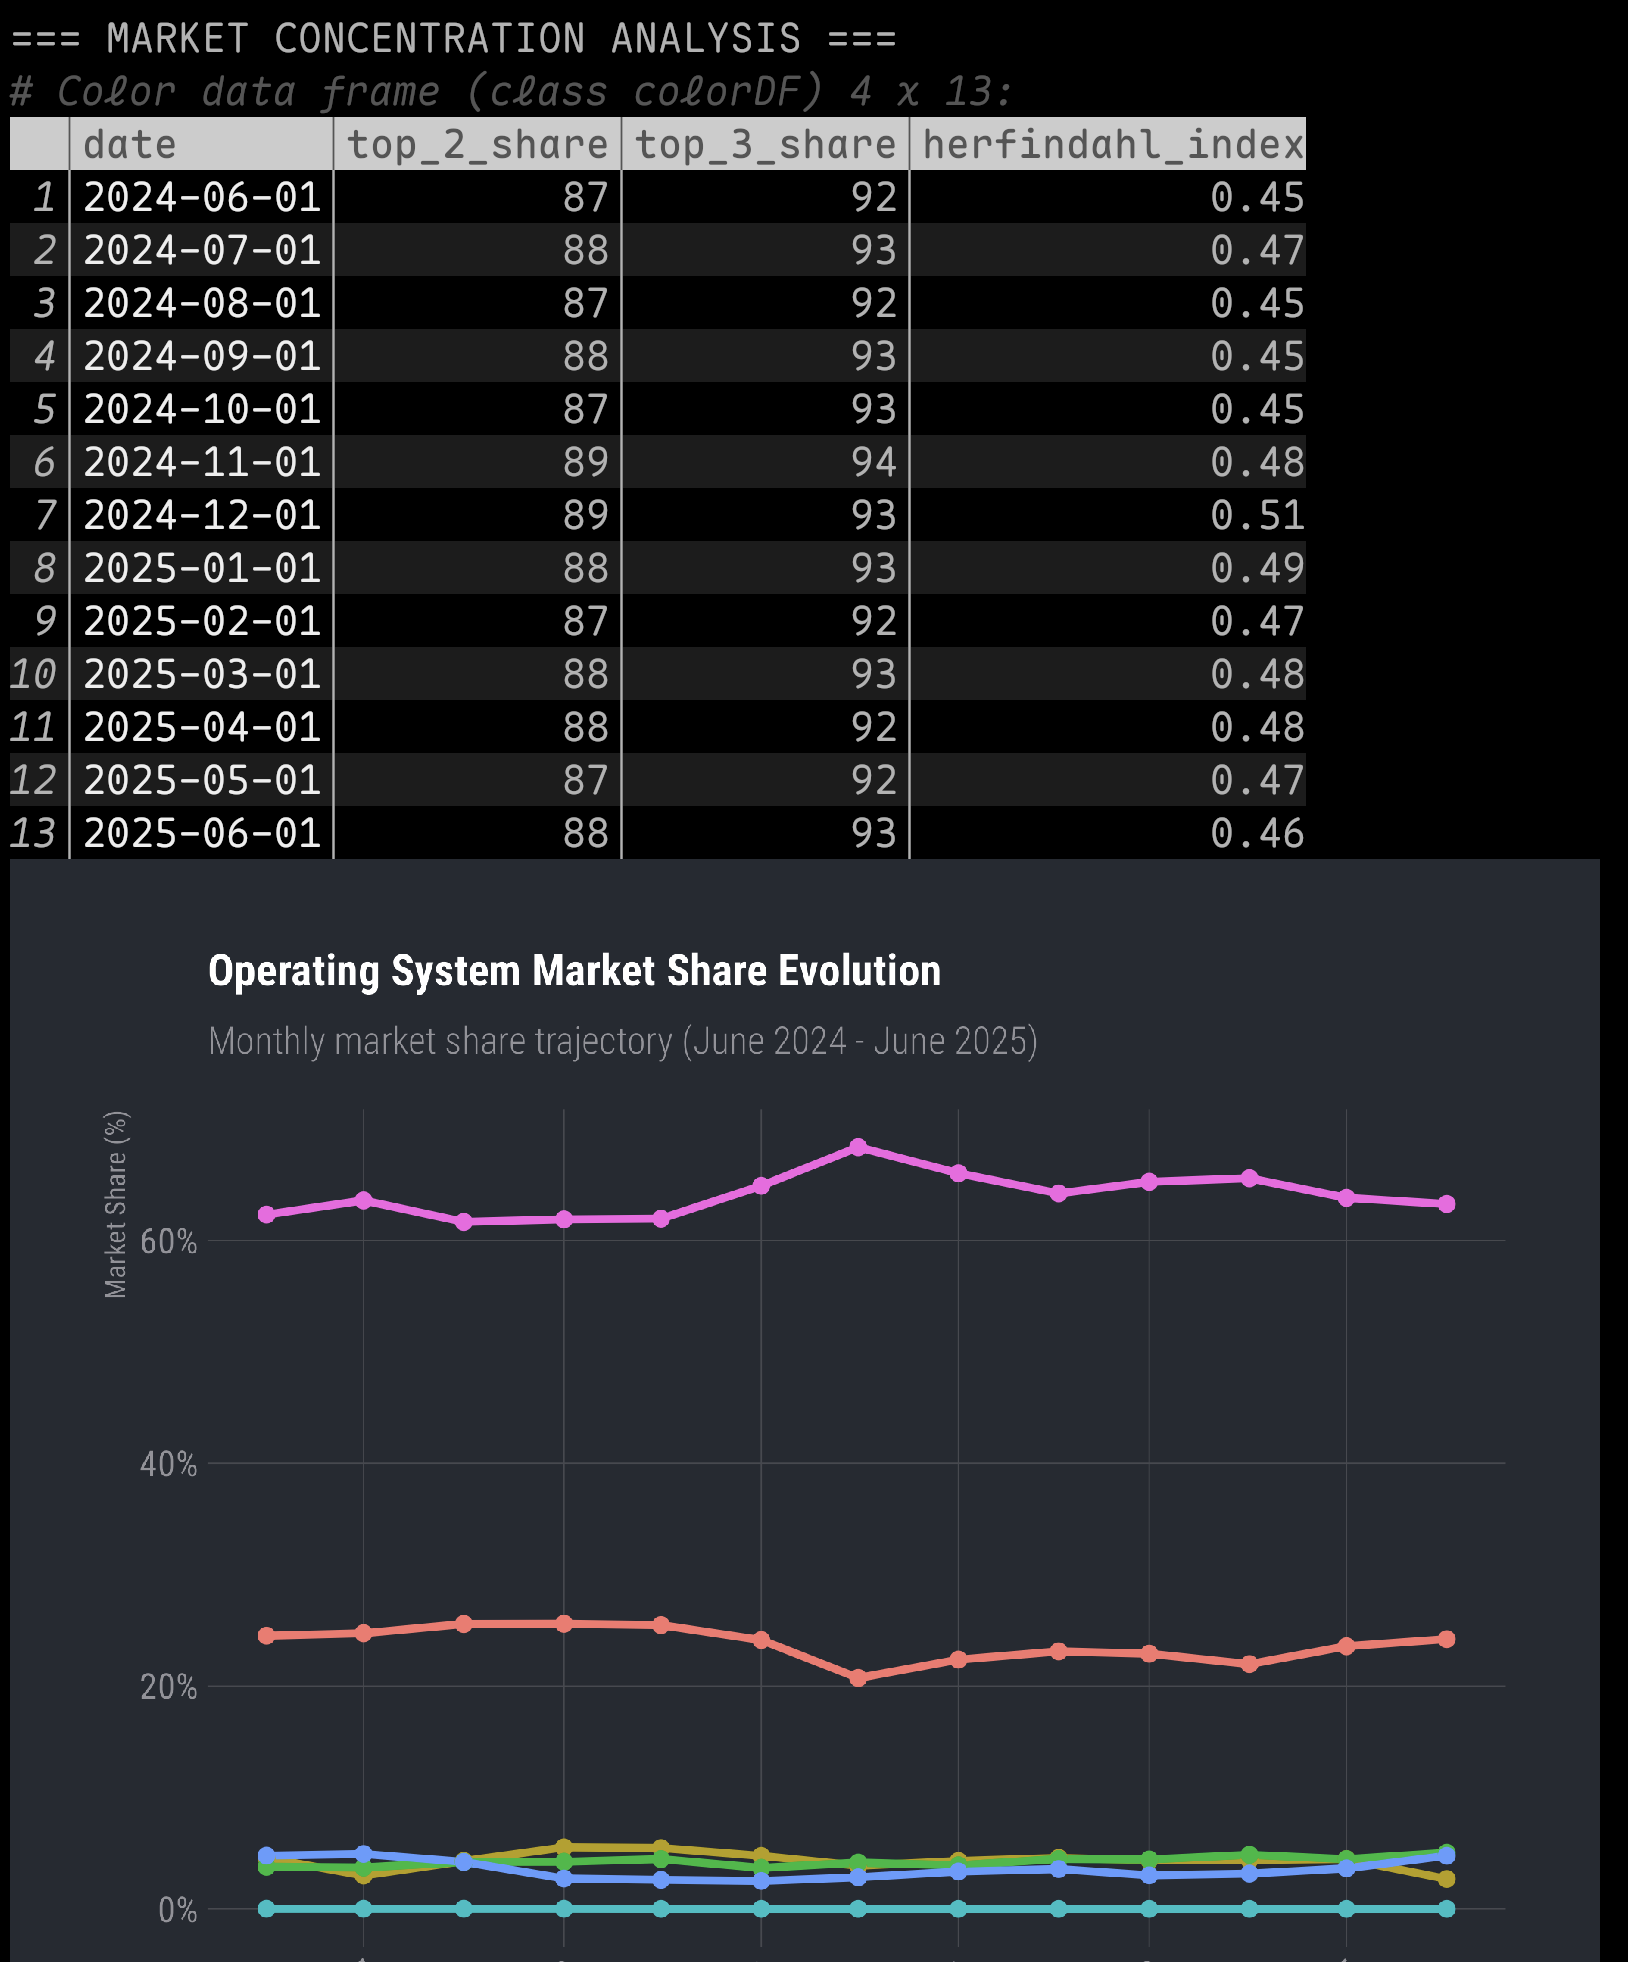
* A table with 13 rows and 4 columns displays data on market concentration.
* The table includes columns for "date", "top 2 share", "top 3 share", and "herfindahl index".
* The dates range from June 2024 to June 2025.
* The top 2 share and top 3 share values are consistently high, ranging from 87% to 94%.
* The herfindahl index values are relatively low, ranging from 0.45 to 0.51.
**Operating System Market Share Evolution**
* A line graph illustrates the evolution of operating system market share from June 2024 to June 2025.
* The graph features a dark grey background with white text and a pink line representing the market share of a specific operating system.
* The market share of this operating system has been steadily increasing, from around 60% in June 2024 to around 65% in June 2025.
* The graph also includes a legend and axis labels, providing context for the data.