Discussion
Loading...

#Tag

  • About
  • Code of conduct
  • Privacy
  • Users
  • Instances
  • About Bonfire
hypebot boosted
Jonathan
@JonathanMBR@mstdn.social  ·  activity timestamp yesterday

The pressure is growing hard against #Tanzania's president Samia Suluhu, as protests intensify.

Standard newspaper headline "Darkness in Dark" with a huge Samia Suluhu's picture on the front page.
Taifa Leo headline "Tanzania Gizani" with police and smoke while dispersing protesters against the government.
Daily nation newspaper with a headline reading "Tanzania on edge" with police and smoke while dispersing protesters against the government
  • Copy link
  • Flag this post
  • Block
Aderenti Escapes su mastodon boosted
Jochen Lingelbach
@JochenLingelba1@h-net.social  ·  activity timestamp 2 days ago

Curfew in Dar after protests at election in #Tanzania

https://www.bbc.com/news/articles/cwy7124p544o

Tanzania election: Curfew in Dar es Salaam after protests on polling day

Several people have been injured in demonstrations that saw roads blocked and vehicles set on fire.
  • Copy link
  • Flag this post
  • Block
Chris Hartgerink (they/them) boosted
NetBlocks
@netblocks@mastodon.social  ·  activity timestamp 3 days ago

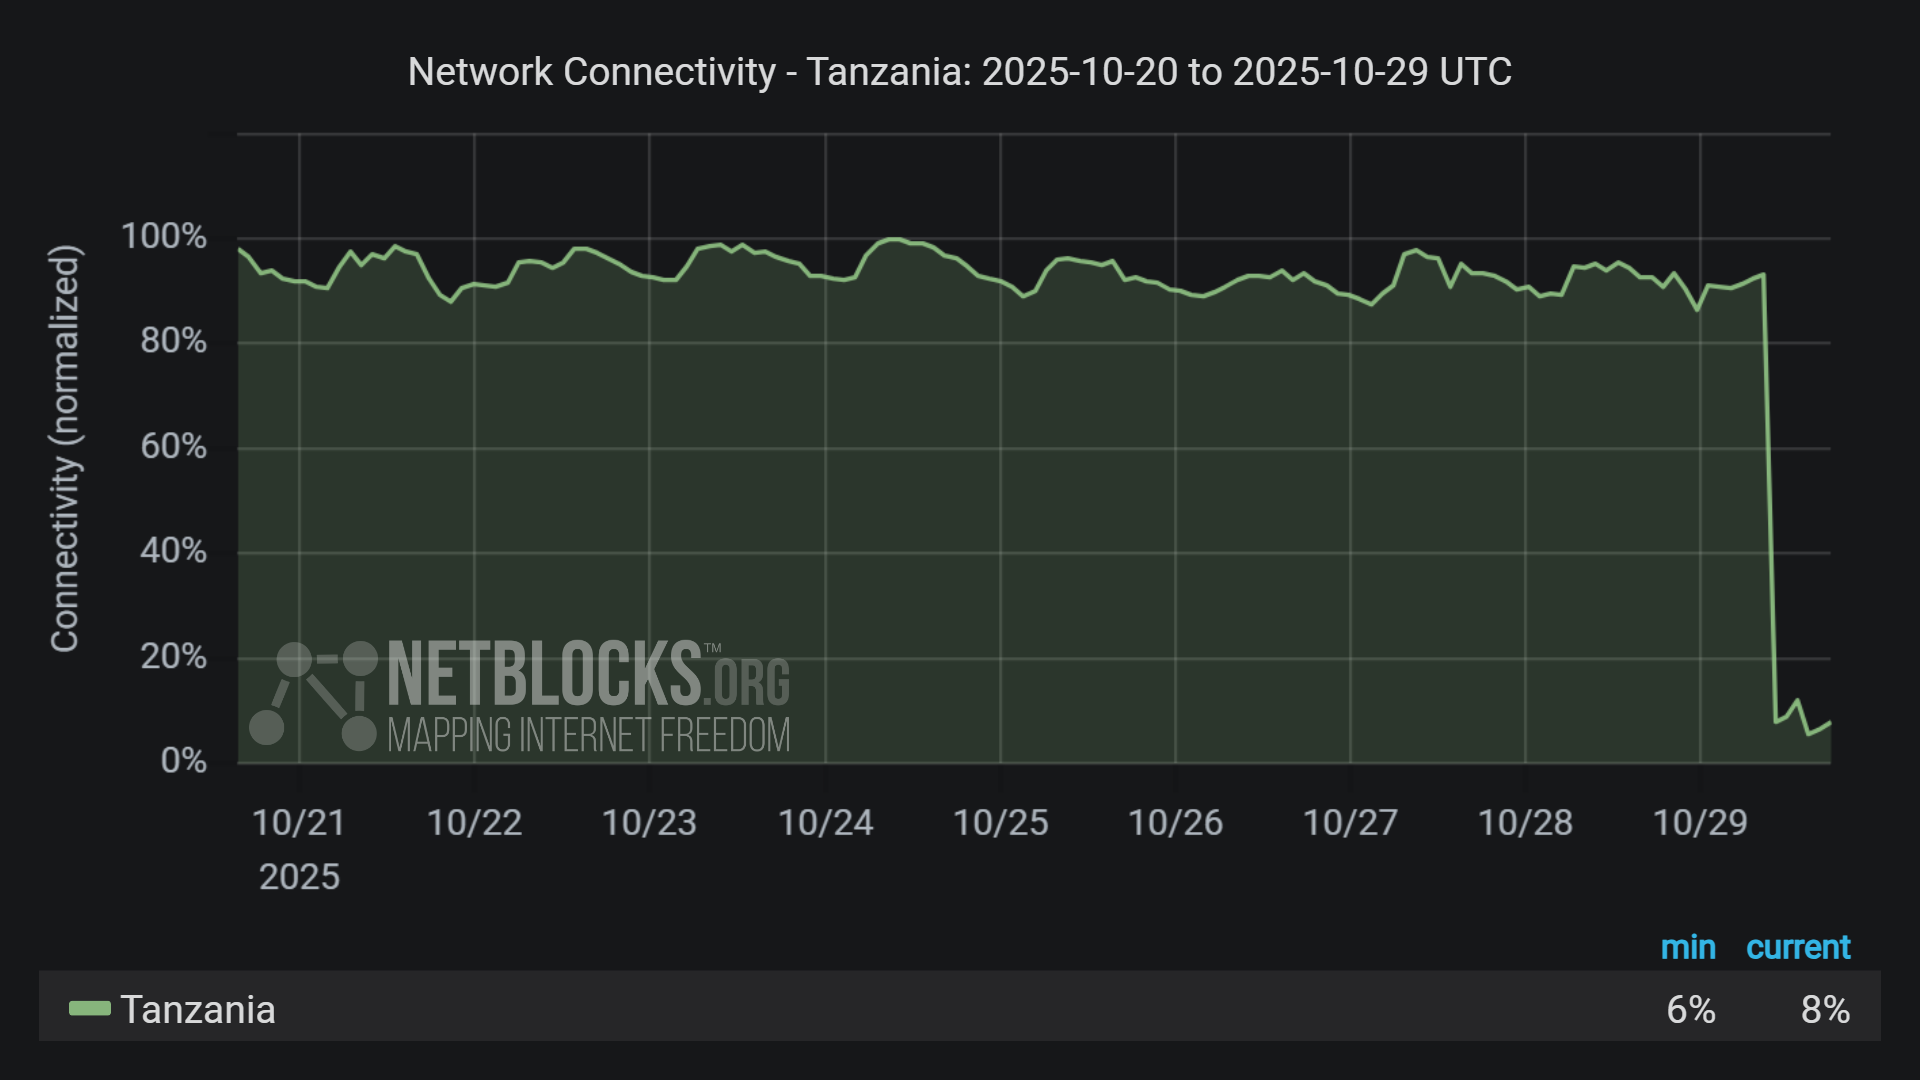
⚠️ Update: #Tanzania remains offline ~8 hours after a national blackout on election day, as news emerges that a curfew is now in place; the measure marks a significant decline in the country's internet freedom, threatening the transparency and credibility of the election process

Graph from NetBlocks showing network connectivity in Tanzania from October 20, 2025, to October 29, 2025. The y-axis represents normalized connectivity, ranging from 0% to 100%, and the x-axis represents the dates. The green line representing Tanzania's connectivity remains stable most of the time period, with a sharp drop on October 29. The minimum and current connectivity levels are indicated as 6% and 8%, respectively. The chart has a dark background.
  • Copy link
  • Flag this post
  • Block
NetBlocks
@netblocks@mastodon.social  ·  activity timestamp 3 days ago

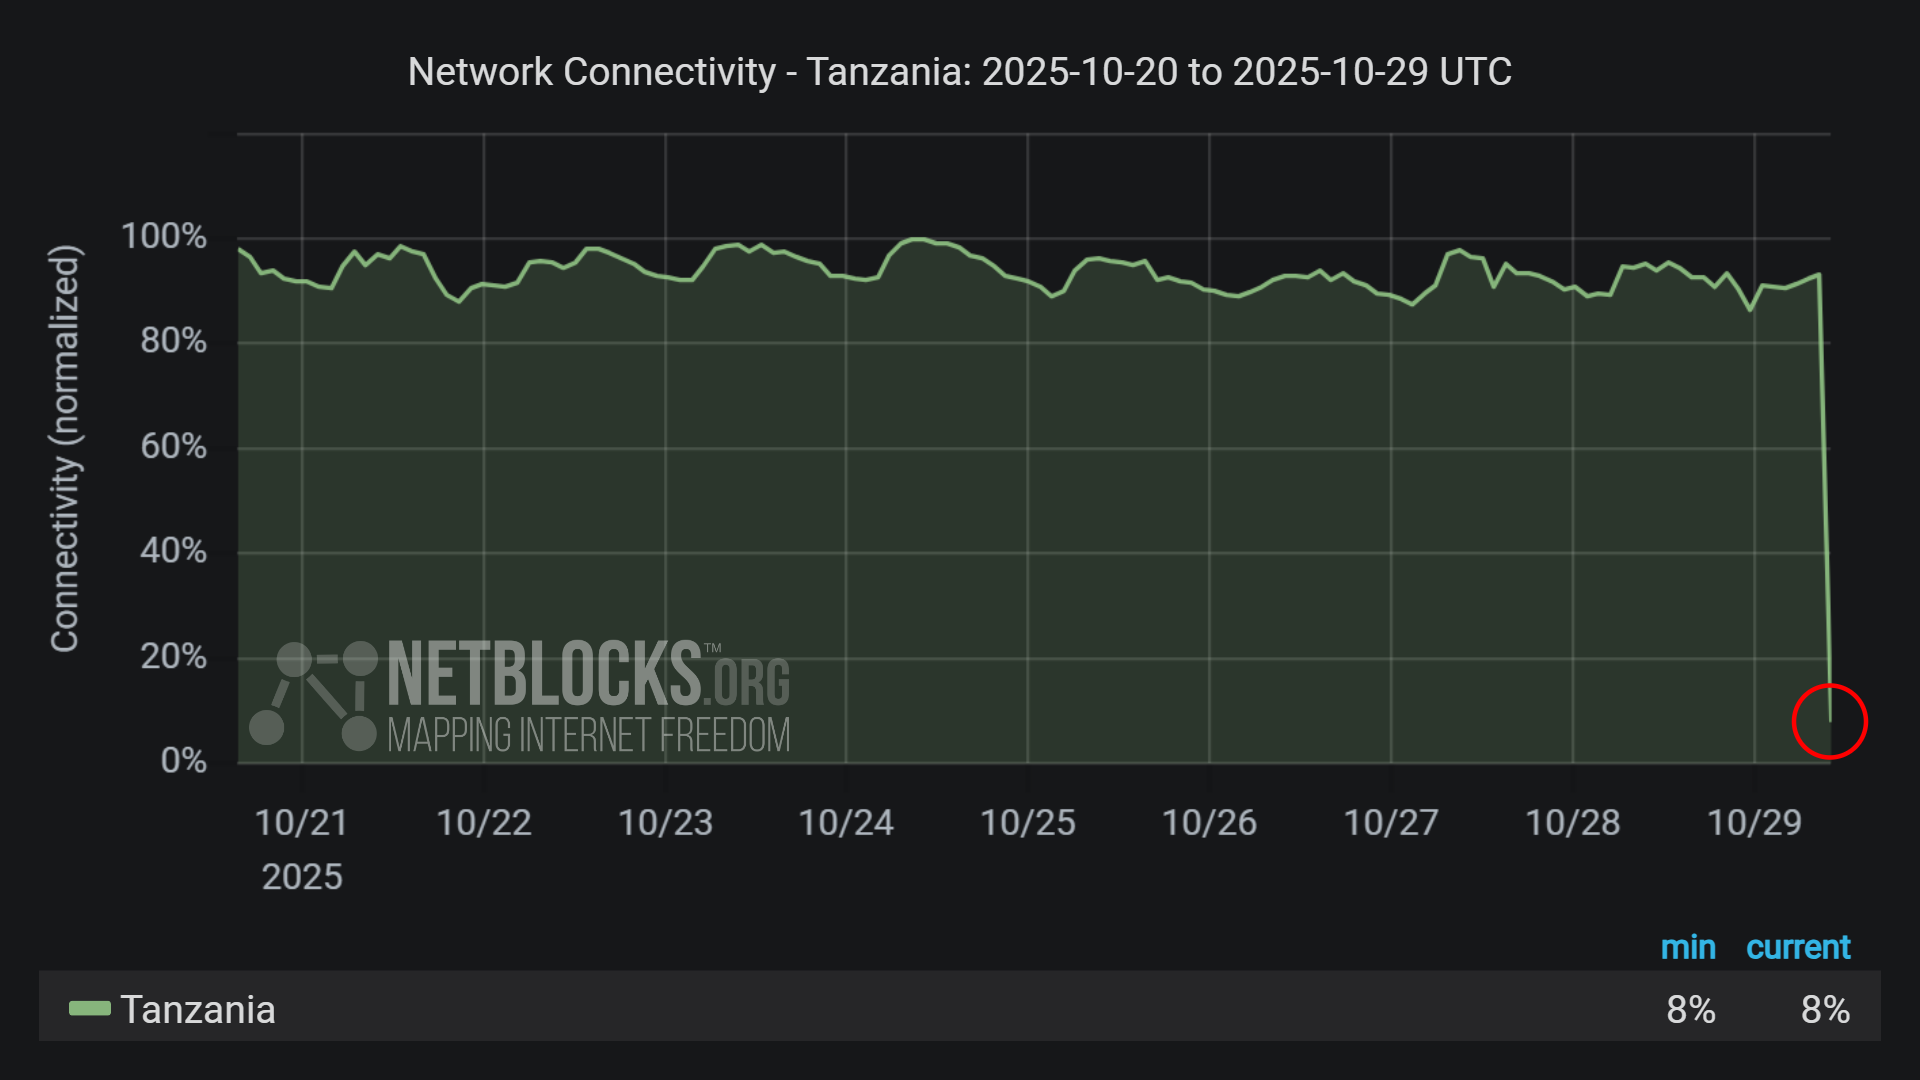
⚠️ Confirmed: Live network data show a nationwide disruption to internet connectivity in #Tanzania on election day, corroborating reports of a digital blackout; the incident comes as Tanzanians vote for a new president and parliament, with both main opposition parties barred

Graph from NetBlocks showing network connectivity in Tanzania from October 20, 2025, to October 29, 2025. The y-axis represents normalized connectivity, ranging from 0% to 100%, and the x-axis represents the dates. The green line representing Tanzania's connectivity remains stable most of the time period, with a sharp drop on October 29. The minimum and current connectivity levels are indicated as 8% and 8%, respectively. The chart has a dark background with a red circle highlighting the decline at the end of the period.
NetBlocks
@netblocks@mastodon.social replied  ·  activity timestamp 3 days ago

⚠️ Update: #Tanzania remains offline ~8 hours after a national blackout on election day, as news emerges that a curfew is now in place; the measure marks a significant decline in the country's internet freedom, threatening the transparency and credibility of the election process

Graph from NetBlocks showing network connectivity in Tanzania from October 20, 2025, to October 29, 2025. The y-axis represents normalized connectivity, ranging from 0% to 100%, and the x-axis represents the dates. The green line representing Tanzania's connectivity remains stable most of the time period, with a sharp drop on October 29. The minimum and current connectivity levels are indicated as 6% and 8%, respectively. The chart has a dark background.
  • Copy link
  • Flag this comment
  • Block
Chris Hartgerink (they/them) boosted
NetBlocks
@netblocks@mastodon.social  ·  activity timestamp 3 days ago

⚠️ Confirmed: Live network data show a nationwide disruption to internet connectivity in #Tanzania on election day, corroborating reports of a digital blackout; the incident comes as Tanzanians vote for a new president and parliament, with both main opposition parties barred

Graph from NetBlocks showing network connectivity in Tanzania from October 20, 2025, to October 29, 2025. The y-axis represents normalized connectivity, ranging from 0% to 100%, and the x-axis represents the dates. The green line representing Tanzania's connectivity remains stable most of the time period, with a sharp drop on October 29. The minimum and current connectivity levels are indicated as 8% and 8%, respectively. The chart has a dark background with a red circle highlighting the decline at the end of the period.
  • Copy link
  • Flag this post
  • Block
NetBlocks
@netblocks@mastodon.social  ·  activity timestamp 3 days ago

⚠️ Confirmed: Live network data show a nationwide disruption to internet connectivity in #Tanzania on election day, corroborating reports of a digital blackout; the incident comes as Tanzanians vote for a new president and parliament, with both main opposition parties barred

Graph from NetBlocks showing network connectivity in Tanzania from October 20, 2025, to October 29, 2025. The y-axis represents normalized connectivity, ranging from 0% to 100%, and the x-axis represents the dates. The green line representing Tanzania's connectivity remains stable most of the time period, with a sharp drop on October 29. The minimum and current connectivity levels are indicated as 8% and 8%, respectively. The chart has a dark background with a red circle highlighting the decline at the end of the period.
  • Copy link
  • Flag this post
  • Block
The Japan Times
@thejapantimes@mastodon.social  ·  activity timestamp 2 months ago

The Japan International Cooperation Agency is set to designate four Japanese cities as “hometowns” for the African nations of Tanzania, Nigeria, Ghana and Mozambique as Japan looks to strengthen exchanges. https://www.japantimes.co.jp/news/2025/08/18/japan/society/jica-hometown-cities/?utm_medium=Social&utm_source=mastodon #japan #society #africa #ticad #africajapanrelations #jica #tanzania #nigeria #ghana #mozambique

  • Copy link
  • Flag this post
  • Block
Log in

bonfire.cafe

A space for Bonfire maintainers and contributors to communicate

bonfire.cafe: About · Code of conduct · Privacy · Users · Instances
Bonfire social · 1.0.0-rc.3.21 no JS en
Automatic federation enabled
  • Explore
  • About
  • Members
  • Code of Conduct
Home
Login