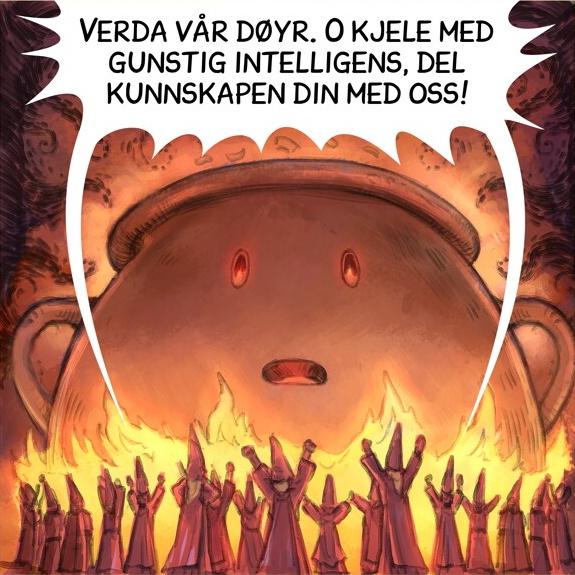
Haha, jeg elsker dette! https://kumlokk.no/
Du vet at Kavli, Korni og Q-Meieriene er eid av Kavlifondet – som gir hele overskuddet sitt til gode formål – sant?
https://kavlifondet.no/om-kavlifondet/
Så, når du skal kjøpe mat, vurder noe av dette:
https://www.kavli.no/produkter
https://www.q-meieriene.no/produkter
Jeg sendte faktisk inn juridisk klage på Zalando for denne skjorta. Grunnen? Jo, fordi skjorta, som er laget av 100% cord (altså bomull) ikke kan vaskes. Selvfølgelig kan den jo det. Men ansvarsfraskrivelse på dårlige tekstiler gjennom svært strenge vaskeanvisninger bør ikke butikker være kjent med. Jeg fikk avslag. #norsktut
Før MDG
Etter MDG
Noen spørsmål?
#oslo #livskvalitet #barn #nabolag #bil #BilfrittByliv #politikk #valg27 #MDG #NorskTut
Har Windows en form for virtuelle skrivebord nå? Uansett vet jeg at Mac har det. Hva kalles disse tingene på norsk?
He’s asleep now, so I’m having some bits of smartphone time before it’s too late. I thought of Mastodon as some Twitter alternative. And looks like it is, but there are definitely things to learn. I’ve been on Twitter since the very beginning, and I have the same vibes (as then) now. Which means good. I have tried Lemmy previously, for a very little while, I have issues with that kind of social media, too addictive. And I was impressed with small communities! As if internet is alive again!
@bjornskjaerpe Welcome! Mastodon and the wider fediverse network is very human centric. My impression is that people are more than willing to help and answer questions.
You can find some accounts to follow at @FediFollows and @norskekontoer
And you can also follow hashtags like #allheimen and #norsktut.
RE: https://mastodon.social/@aslakr/116079409543866250
Finnes det noen scifi om milliardærer som utvikler noe fantastisk nyttige systemer for å gjøre jobb og ta avgjørelser og som, når de viktigste institusjonene i verden har gjort seg avhengige av dem, sakte, men sikkert, vrir på bryterne og får systemene til å gjøre og anbefale det milliardærene har mest nytte av – til de tilslutt har tatt over verden uten å avfyre ett skudd?
Den boka vil jeg gjerne lese.
MDG sitt funkisnettverk arrangerer webinar med lansering av sin nye verktøykasse for hvordan man kan lage arrangementer som er inkluderende og lett for folk med diverse funksjonshemminger å delta på.
Veldig nyttig for alle som er aktive i noen som helst form for org e.l., og åpent for alle. Starter nå kl 18. Mer info + link: https://docs.google.com/forms/d/e/1FAIpQLSeKvtuX011QLSeZYnH0sOEKUYDX3bJj7flyxNcyio8tL9DQ7w/viewform
Jeg har lyst til å gjøre det lettere å bruke kartet over uavhengige sjapper, og vil så kjøpe et domene som er passende og lett å huske og helst litt kort.
Håpet er å utvikle sida til å også inneholde uavhengige nettbutikker og informasjon om hvorfor det er viktig å støtte de uavhengige, så ikke alt bare blir store kjeder.
Forslag til et ledig .no-domene?
Ting jeg har tenkt på: frittstående, sjølvstendig. Uavhengig er selvsagt ikke ledig.
https://umap.openstreetmap.fr/en/map/uavhengige-sjapper_859787
Ouf! Jeg har mer enn doblet strømforbruket mitt fra jan 25 til jan 26! Hva skjer? Er det Norgespris-effekten?
Arild Torvund Olsen og eg har endeleg fått omsett dei siste episodane (episode 27–39) i David Revoy (@davidrevoy) sin humoristiske teikneserie Minifantasyteateret til #nynorsk. Denne gongen handlar det mykje om KI (dvs. Kvitrande Intelligens): https://www.peppercarrot.com/nn/webcomics/miniFantasyTheater.html
Heile serien er tilgjengeleg under #CreativeCommons (CC BY-SA 4.0).
Hot tips: I Rostockgata 74 finner du en offentlig tilgjengelig sykkelvask, om du bare triller ned i p-kjelleren. Du finner en åpen port på den siden av Clemenskvartalet* som er i retning Sørenga/Losæter.
Det er lurt å spyle av litt salt innimellom har jeg hørt. Men jeg har nesten aldri gjort det alle åra jeg har syklet gjennom vinteren, siden jeg ikke har tilgang til noe slikt.
*Du vet, de eneste bygningene i området med litt farger.
Today is European 112 Day 🇪🇺
📞 112 is the EU’s single emergency number.
It connects you to ambulance, fire brigade or police. It’s free of charge across Europe and offers language support in many countries.
A life-saving number everyone should know.
RE: https://mastodon.social/@jeffjarvis/116041242464510649
Betimelig massemedie-nekrolog fra Jeff Jarvis.
I irsk avis. Fikk lese saken etter å ha gått ut ved tilbudet og lastet den en gang til.
Vi har kanskje en sjanse , men det røyner jo på.
Ireland's @TheJournal asked me to write about the Washington Post. I wrote its obituary--and mass media's. Don't save it. Replace it.
From watchdogs to mouthpieces: Washington Post and the wreckage of legacy media https://jrnl.ie/6950317
Var det sånn seinkapitalismen skulle sjå ut?
Godt det ihvertfall er noen i H som skjønner litt av alvoret i at ledende skikkelser har vært i kretsene til milliardærer mest kjent for å drive med seksuelle overgrep mot barn. Men jeg tviler på at partiet som helhet skjønner dette, eller har lært noe som helst av problemene de fikk ved å tviholde på Erna Solberg etter hennes korrupsjonssak. Og det er jo så kort tid til ledervalget, kan jo ikke gjør noe med det nå, systemet må gå sin gang, må vite! https://www.tv2.no/nyheter/lokallagsleder-i-hoyre-vil-utsette-utnevnelsen-av-ny-partiledelse-bor-tenke-seg-om/18544432/


